
Introduction
This tutorial aims to show the functionality of the CAD-score web server using an example job.
If you are not familiar with CAD-score method, we recommend reading a very short theoretical description.
Example job
A target protein structure and five models from CASP10 were used to submit an example job.
Links to the protein structure files used for submission:
target,
model 1,
model 2,
model 3,
model 4,
model 5
(all files are in PDB format).
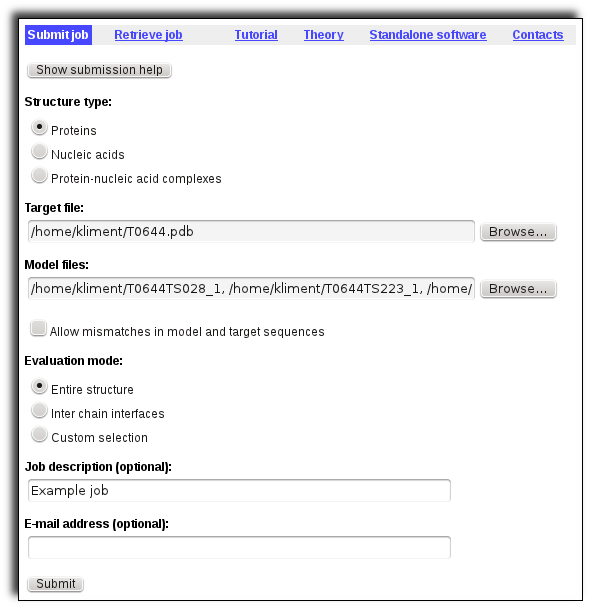
Submitting a job
The screenshot below shows how the submission form for the example job was filled. A short help for filling-in the submission form is available by clicking "Show submission help" button at the top of the form.
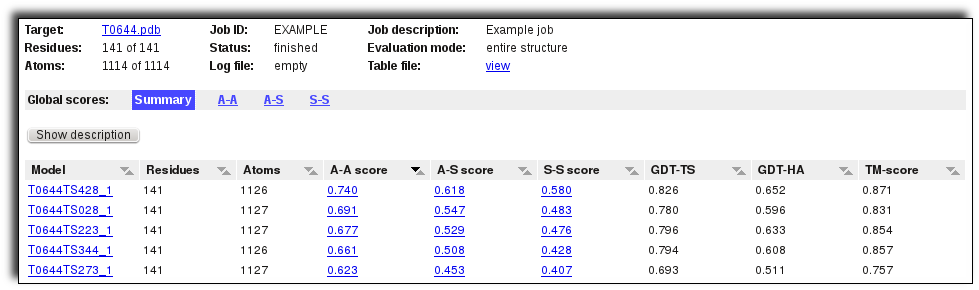
Exploring global scores tables
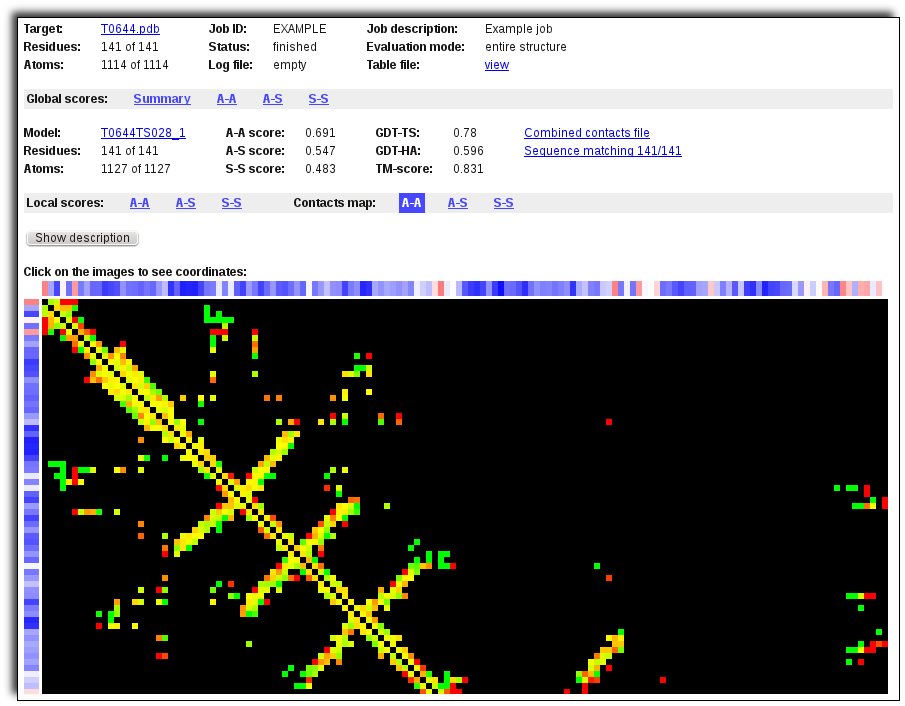
Once the job is completed, a global scores summary table is shown. It can be sorted by values of any column. Links in "Model" column refer to the originally uploaded model files. Links in scores columns refer to local scores views.
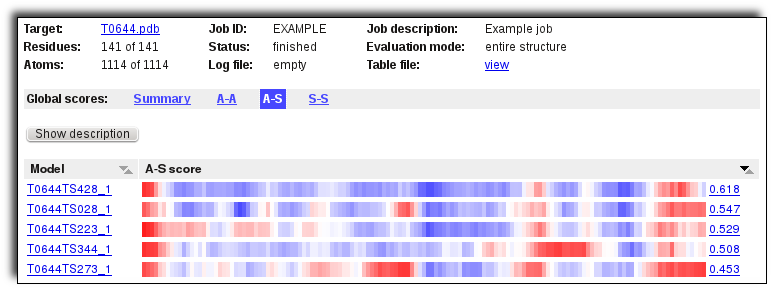
You can use horizontal menu links to go to a table devoted to some particular CAD-score type. Besides global scores it also shows color-coded smoothed local contact difference profile images. The "Model" column contains links to the model files in PDB format. B-factors in these files correspond to local contact area difference values scaled for structure coloring. Clicking on a local contact area difference profile image opens the appropriate local scores page.
Exploring local scores
A local scores page shows clickable color-coded profiles of local contact area differences generated with smoothing windows from 0 to 3. "model" and "target" links next to the profile images allow to download the model and the target PDB files. B-factors in these files correspond to local contact area difference values scaled for structure coloring. A color-coding legend can be shown by clicking "Show description" button.
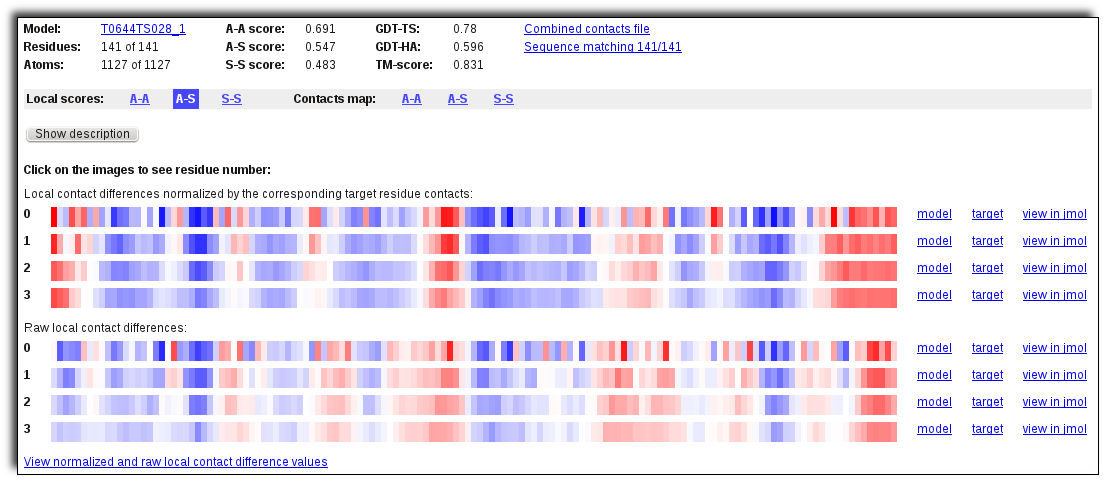
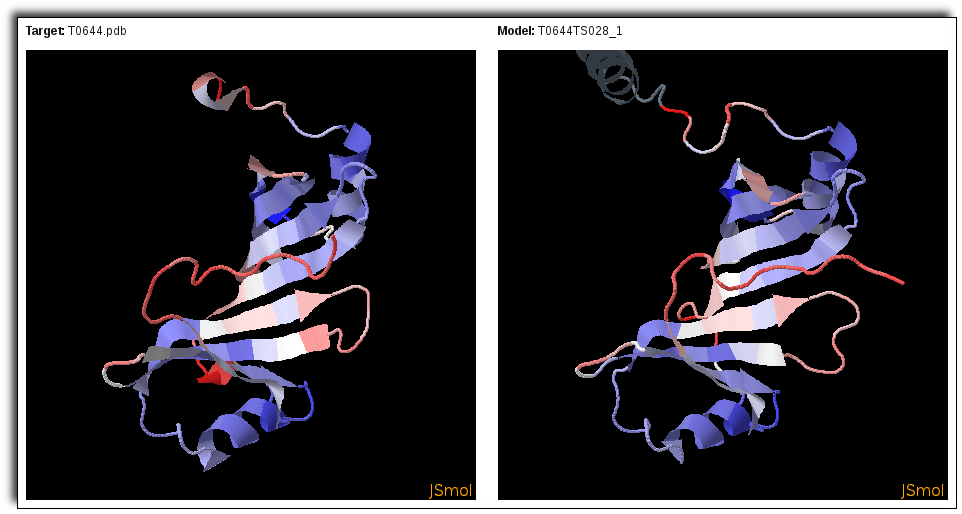
"view in jmol" link opens a new page with the colored model and target structures displayed using JSmol applet.
Exploring contact maps
You can use horizontal menu links to go to a contacts map page. This page shows clickable color-coded superimposed contact maps for the model and the target. The corresponding clickable color-coded local contact area difference profile is shown at the top and left boundaries of the map. Contacts between residues are represented as colored points on the black background. Residue contacts in the target are red, in the model are green. The color of overlapping contacts consists of red and green components mixed with a ratio proportional to the corresponding contact areas in the target and in the model. A color-coding legend can be shown by clicking "Show description" button above the contacts map.
This site uses cookies to enhance the user experience. By using the services, you agree to our privacy policy. |