PPI3D Help
Query input
Three input modes are available in the PPI3D server. Single-sequence queries search for interactions between homologs of input proteins and other proteins, peptides or nucleic acids. Two-sequences queries search for protein-protein interactions between homologs of input proteins in the PDB. Both sequence search modes take protein sequences as input. PDB entry search retrieves all protein-protein interactions in one PDB entry given it's ID.
Input of query sequences
In order to search for structural data on interactions of homologous proteins, you have to input one or more protein sequences.
Two methods of query sequences input are possible.
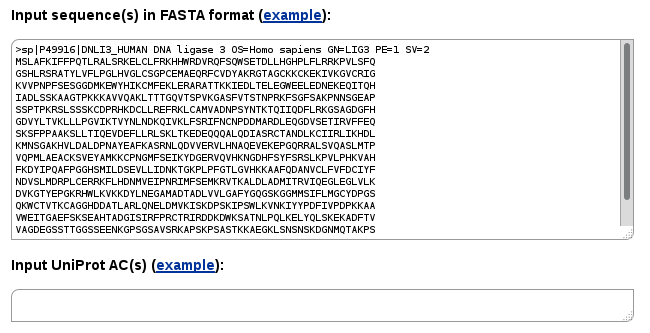
You may paste FASTA-formatted ![]() protein sequences or input comma-separated list of UniProt Accession Codes (ACs) into the corresponding fields.
In the latter case query sequences will be retrieved automatically from UniProt.
Unique sequence identifiers are expected if FASTA-formatted input contains more than one protein sequence.
protein sequences or input comma-separated list of UniProt Accession Codes (ACs) into the corresponding fields.
In the latter case query sequences will be retrieved automatically from UniProt.
Unique sequence identifiers are expected if FASTA-formatted input contains more than one protein sequence.
Entering a sequence into Single-sequence mode, you may search for all the interactions of a query protein and its homologs available in the structural database. Available protein-protein, protein-peptide and protein-nucleic acid interactions will be retrieved.
Instead of a single sequence, you may enter multiple sequences. In such case the search will be performed for every input sequence.
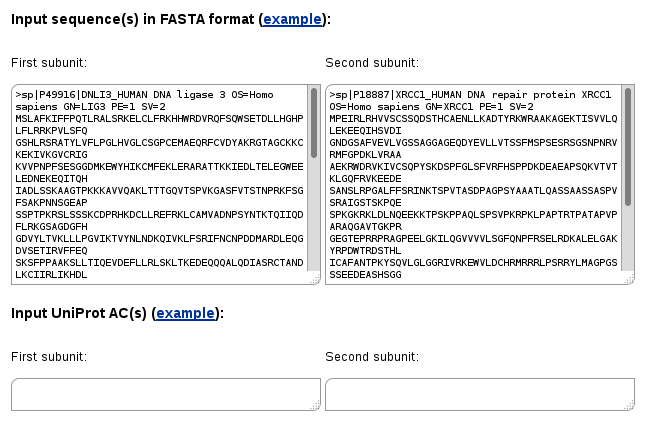
In the Two-sequences search mode you have to input at least two sequences, one into the "First subunit" form and the second one into "Second subunit". Similarly, input of UniProt ACs is also possible.
In this case only protein-protein and domain-domain interactions in which the first and the second proteins (or their homologs) interact with each other will be retrieved.
You may also enter multiple sequences in each form. In such case all possible pairwise combinations will be queried. This may be useful to find out if there are proteins in two groups that have 3D structures of their complexes (complexes of homologs) solved experimentally.
Choosing sequence search method and settings
You may choose either BLAST for finding only close homologs or PSI-BLAST if you want to also include remote homologs. The PSI-BLAST method builds a profile using clustered NCBI non-redundant protein sequence database and then uses the generated profile to search against the PPI3D webserver sequence database. The NCBI BLAST+ software [1] is used for both types of searches. By clicking on "Advanced sequence search options" you may customize your sequence search settings.
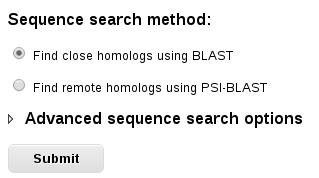
Some searches, especially using PSI-BLAST, may take some time. Therefore you may want to either bookmark the page where results will be displayed or enter your email address in order to receive a link to the results once the job is finished. Optionally, you can specify a name for your job.
Using the PDB entry search
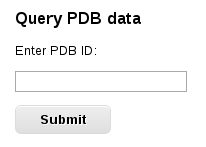
If you want to explore all binary protein interactions with proteins, peptides of nucleic acids present in one PDB entry, you may retrieve them by inputting a PDB ID into the PDB entry search form.
Analyzing the sequence search results
The results of sequence search are displayed in stepwise manner. First, only the summary of results is shown with the numbers of structurally-resolved interactions of different types found for each query sequence or sequence pair. Then all homologous binary interactions for one sequence (or sequence pair) can be listed and analyzed in the "Clustered results" table. The detailed data for every interaction interface is visualized in "Interaction details" page.
In case of single-sequence search the results are the binding sites in the homologs of query sequence which bind another proteins, peptides or nucleic acids.
In case of two-sequences search the results are the interaction interfaces, where the first protein is a homolog of the input sequence for the first subunit, and the second protein is homolog of the second subunit.
Results summary window
When the job finishes, a window containing the summary of results will be displayed (Single-sequence example, Two-sequences example).
If the search was performed using multiple sequences (single-sequence mode) or two groups of multiple sequences (two-sequences mode) only those sequences or sequence pairs that produced any results will be reported.
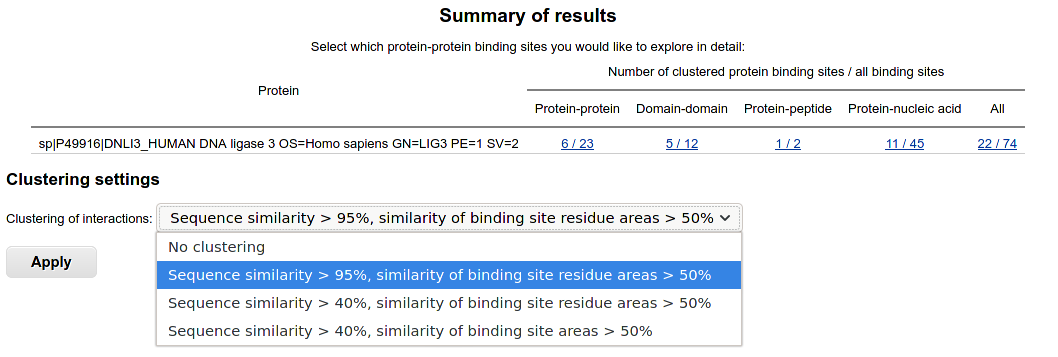
The identified binding sites are displayed for single-sequence queries.
They are classified into protein-protein, domain-domain, protein-peptide and protein-nucleic acid binding sites.
Proteins are full chains of proteins in the PDB, domains correspond to protein domains in SCOPe ![]() classification.
PDB proteins and SCOPe domains having less than 20 residues are classified as peptides.
classification.
PDB proteins and SCOPe domains having less than 20 residues are classified as peptides.
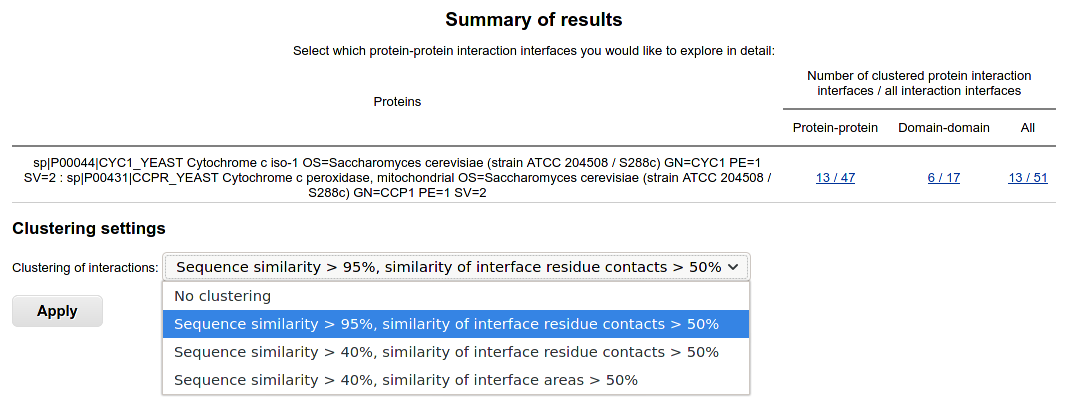
Binary interaction interfaces are shown in case of two-sequences query. The results are classified to protein-protein and domain-domain interfaces.
Clustering of protein interaction interfaces and binding sites
By default, clustering of interactions is applied in order to reduce the redundancy of PDB data. Experimentally determined structures of proteins interacting with proteins, peptides or nucleic acids having resolution better than 4 Å are first clustered by protein sequences and then by interface (binding site) similarity. You may choose several clustering levels:
- Sequence similarity > 95%, similarity of interface residue contacts (areas) > 50%: identical or nearly identical interfaces (binding sites) clustered;
- Sequence similarity > 40%, similarity of interface residue contacts (areas) > 50%: highly similar interfaces (binding sites) clustered;
- Sequence similarity > 40%, similarity of interface (binding site) areas > 50%: similar interfaces (binding sites) clustered;
The binding sites are clustered according to only one protein. As a result, if there are binding sites that interact with completely different proteins, peptides or nucleic acids, they fall into the same cluster. Alternatively, two entries may be shown for an asymmetric homo-interaction interface, where the binding sites are different in the subunits.
The results of clustering are pre-calculated in the PPI3D database and therefore changes in the clustering levels take effect immediately after pressing "Apply". This is useful for selecting an optimal number of clusters for detailed analysis.
Clustered results window
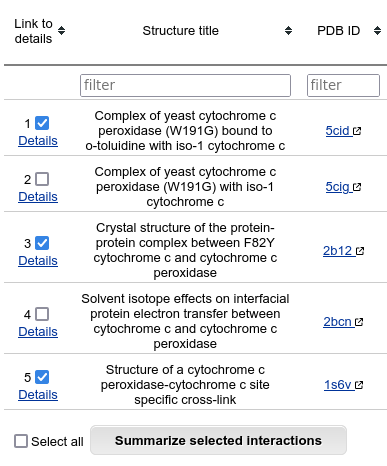
More detailed analysis of the identified protein interaction data can be done in Clustered results window.
Data for the identified interactions, including the PDB entry information, BLAST E-values, SCOPe data and some of the interaction interface properties are displayed in a table. This table can be sorted by any column. Filtering of table rows can be done by entering criteria to boxes in the table header. Tables may be filtered by text, regular expressions or numerical values (>, >=, <, <=, range using "-"). Combining filters using "and" and "or" is also possible.
If you would like to analyze the results in your computer, you may download the table in tab-delimited format by clicking "Download table data". By default filters are also applied to downloaded data.
The last column of the table shows the number of members in the cluster, for which only one representative is shown. It is possible to list all the members of the cluster by clicking on this number.
If you want to see all the available details for a specific interaction, click on it's number in the first column. If you want to summarize interface data about several interactions, you may select some of table rows and click on "Summarize selected interactions".
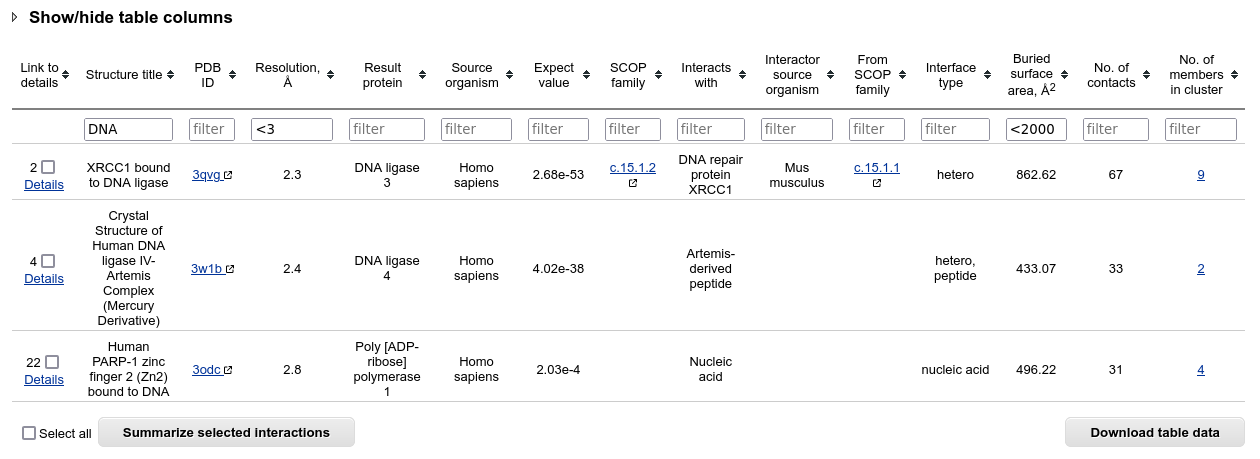
The Clustered results table can be easily filtered according to interaction types or clustering by choosing filtering settings below the table.
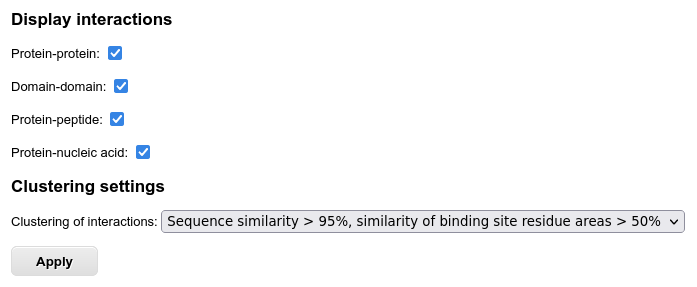
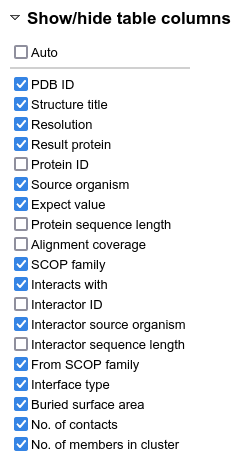
Moreover, the columns of the table can be hidden, enabling the user to focus on the most important data. Note that some columns (like protein IDs or alignment coverage) are hidden in the default view.
Aligned interactions window
In some cases the clustering of protein interaction interfaces and binding sites does not group all similar protein interactions into the same cluster. This can happen, for example, if the sequences of proteins differ too much. Therefore sometimes it is necessary to visually compare the results from several clusters.
If you select several protein interactions in the "Clustered results" window and click on the "Summarize selected interactions" button, the "Aligned interactions" window opens in a new tab.
First, the table with sequences of the result proteins aligned to the query sequence are shown. The residues that are part of the interaction interface are highlighted in red. The residues of the result proteins that are missing in the BLAST or PSI-BLAST alignment are displayed as spaces, and the residues that are aligned to gaps in the query sequence are omitted from this multiple sequence alignment.
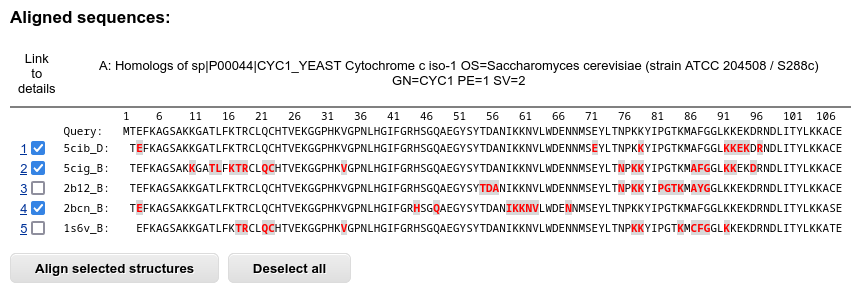
You may select two or more protein interactions for the structural alignment.
The structures of binary protein interactions are then aligned chain by chain using TM-align ![]() .
.
In case of two-sequences query, two JSmol windows are shown, displaying the interactions aligned according to the first and the second chains. For a single-sequence query only one alignment is shown as the second chains may be very different.
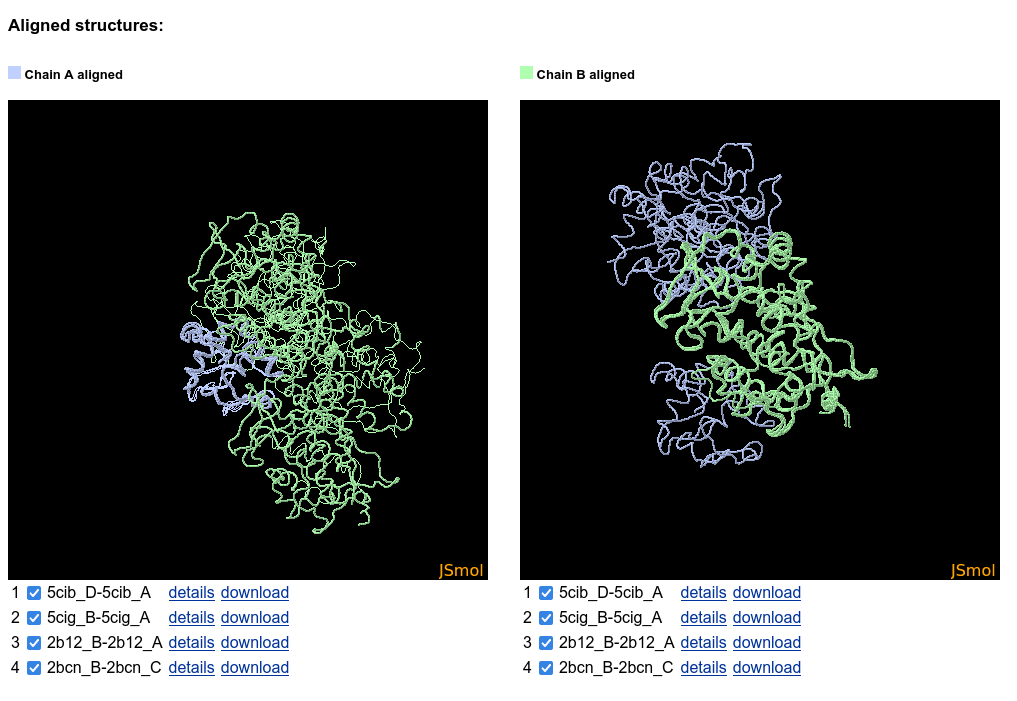
The structures may be hidden in the JSmol by deselecting the checkboxes. Interaction details can be viewed by clicking the "details" link, and after clicking on the "download" link the aligned structures may be downloaded for more detailed analysis.
Interaction details
The Interaction details window is divided into three main sections.
The first section shows PDB and SCOPe data for the interaction.
The "Structural properties" section lists calculated properties of the interaction interface. In addition it provides a possibility to explore the structures of both interacting domain pair and the entire biological assembly, in which interaction takes place, using JSmol. The interface is shown in different colors, and it's residues that form hydrogen bonds, salt bridges or disulphide bonds can be visualized by clicking JSmol buttons. Coordinates of both structures can be downloaded.
You can also create a homology model for your sequences using the structure of interacting domain pair as a template.
The model for single-sequence queries is constructed with MODELLER [3] followed by aligning the model to template, thus allowing inference of the binding site.
In case of two-sequences queries MODELLER with AltMod ![]() plugin [4] is utilized followed by model selection using full structure and interaction interface VoroMQA
plugin [4] is utilized followed by model selection using full structure and interaction interface VoroMQA ![]() [5, 6].
The homology models include only the sequence regions aligned with the template (see "Sequence alignments" below).
All the modeling data (the input alignment, modeling script, the model and other data) are available for downloading.
[5, 6].
The homology models include only the sequence regions aligned with the template (see "Sequence alignments" below).
All the modeling data (the input alignment, modeling script, the model and other data) are available for downloading.
If the binary protein interaction is taken from a homo-oligomer containing 12 or less chains, it is also possible to model the structure for the whole protein complex. This modeling uses the same procedure as for two-sequences queries.
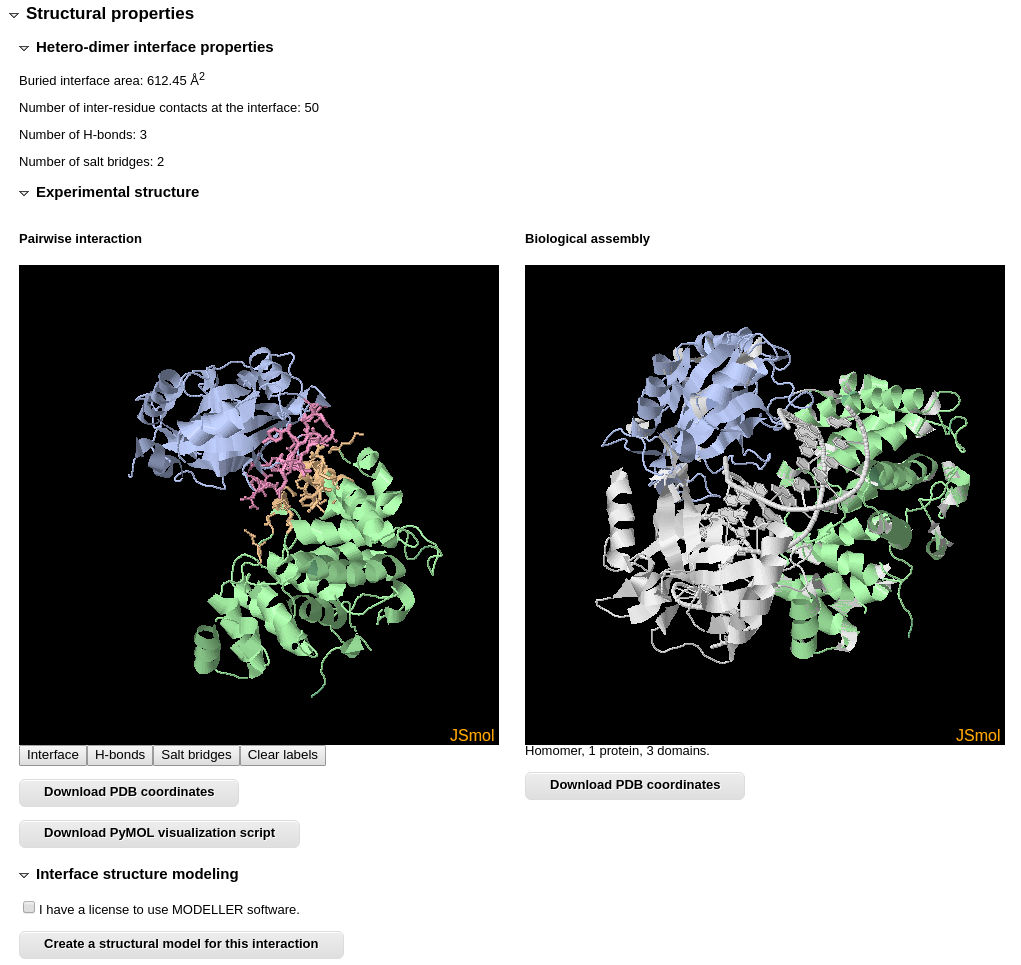
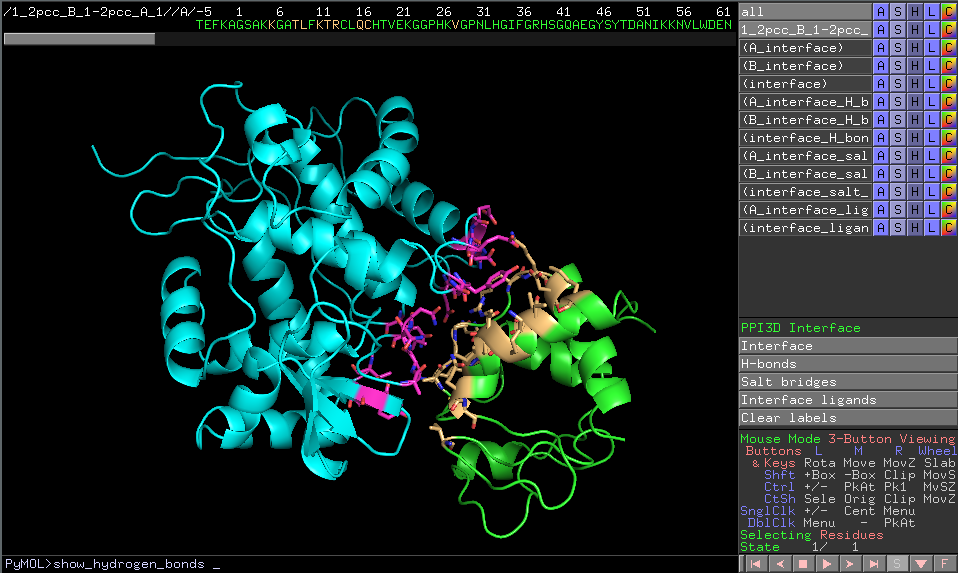
Visualization of the interface structure can be also downloaded as PyMOL script. Download the script file and open it with PyMOL. The functions that are available in JSmol are also implemented in this script. They are accessible by clicking buttons in the PyMOL's Control Panel or from command-line.
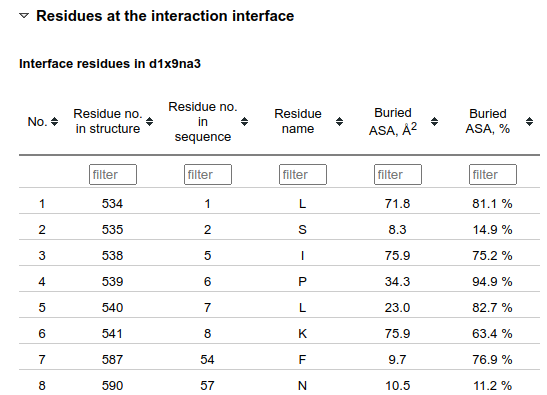
The bottom of the Structural properties section contains tables with the information about individual interface residues. In order to have more concise view, this part is hidden when the page is loaded.
Numberings of the residues in the 3D structure and in the sequence alignment are given in separate columns as they often differ. "Buried ASA, Å2" is the solvent-accessible surface area (ASA) of the residue that is buried upon the interface formation from unbound subunits. "Buried ASA, %" indicates which percentage of the residue ASA in the unbound subunit becomes buried.
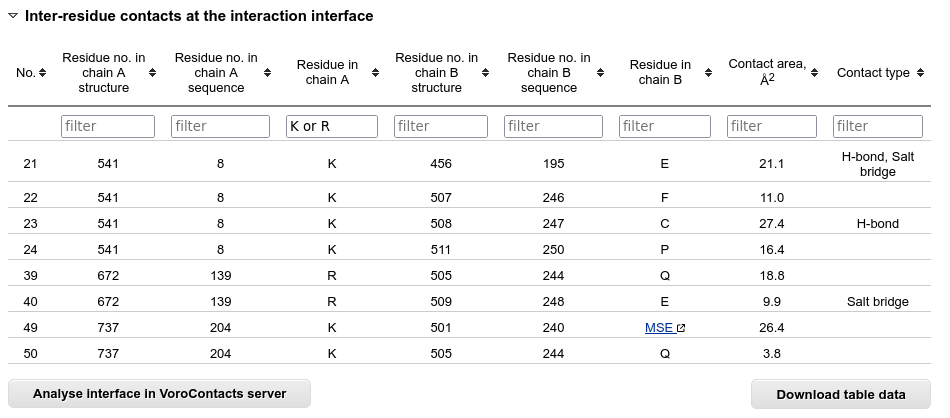
The inter-residue contacts across the interaction interface are listed in a separate table.
Below this table there is a button that sends the structure to the VoroContacts ![]() server dedicated to more detailed contact analysis.
server dedicated to more detailed contact analysis.
If the interaction interface contains any small-molecule ligands, they are also listed in a table. Clicking on the name of the ligand molecule opens it's detailed information available at the RCSB PDB website.
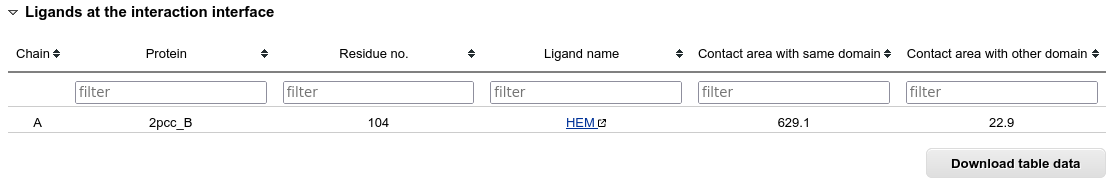
Sorting, filtering and downloading is possible for all tables as described above in the "Clustered results window" section.
The "Sequence alignments" section relates your query sequences to experimental structure by showing corresponding amino acid residues. Sequence conservation parameters are displayed for both entire alignment and interaction interface residues. The residues that are at the interface are highlighted. Additionally, secondary structure of the result protein is displayed (H - helix, E - strand). The sequence alignment can be downloaded in FASTA format.
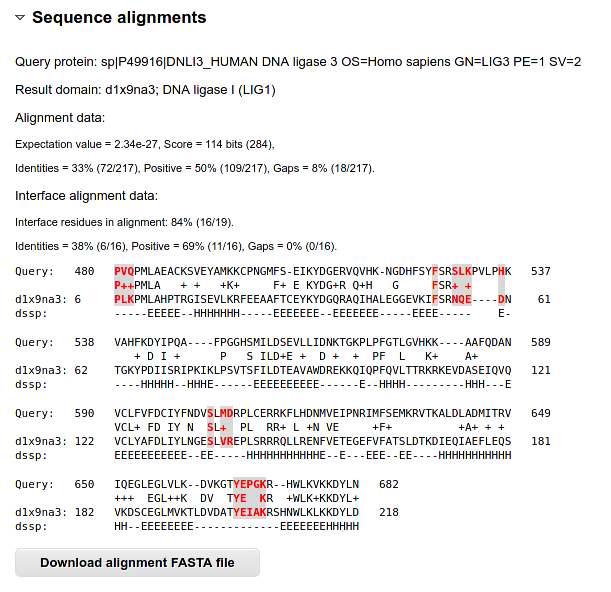
Hiding of some parts of "Structural properties" section and the "Sequence alignments" sections is possible by clicking on their headers.
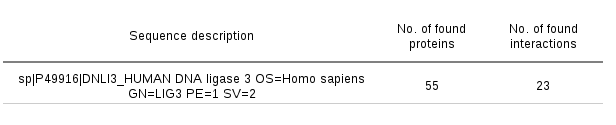
Sequence search log
A sequence search log page is available for every job. In this page, the sequence search settings and other job details are displayed. In addition, the numbers of found protein structures and detected protein-protein interactions for these structures are displayed for every query sequence. Examining these tables may be especially useful in the cases when the server produces no results.
Analyzing the PDB entry search results
The PDB entry search produces almost the same output as the sequence search, except that analysis of sequence alignments and modeling of protein structures are not possible, as no protein sequence is given. Other properties (clustering of interactions, listing their properties and detailed analysis of structures, residues and inter-residue contacts at the interaction interface) work in the same way as described above.
Downloading PPI3D data
To retrieve customized subsets of PPI3D data, go to the data download page. This page displays a data request form, which allows specifying different interaction types, PDB data-related criteria, complex types (for example, selecting homodimers or heterodimers) and sizes, interface properties and desired clustering level.
After submitting the form, the server queries the database. This usually takes several minutes, depending on the number of retrieved interfaces. Afterwards, the links to downloadable CSV formatted table, the user's criteria in a JSON file and a log file are given together with the document describing the table fields. In addition to the requested data, the CSV file also contains a link to download the structure of binary interaction in the PDB format. The queries are cached, therefore, if someone asks for the same dataset, the already saved data are given.
Browser compatibility table
The PPI3D web server has been tested and functions correctly on the following browsers:| OS | Chrome | Firefox | Microsoft Edge | Safari |
| Linux | 120 | 121 | n/a | n/a |
| MacOS | 121 | 122 | n/a | 15.6 |
| Windows | 121 | 122 | 121 | n/a |
Troubleshooting
If you experience any problems using the PPI3D webserver or have any suggestions how it could be improved, you may contact us by email ppi3d (at) bti (dot) vu (dot) lt.
Citing the PPI3D web server
If the PPI3D software is useful for your research, please cite the following article:
- Dapkūnas J, Timinskas A, Olechnovič K, Tomkuvienė M, Venclovas Č. PPI3D: a web server for searching, analyzing and modeling protein-protein, protein-peptide and protein-nucleic acid interactions. Nucleic Acids Res, 2024, DOI: 10.1093/nar/gkae278, PMID: 38619046.
The first PPI3D publication is this article:
-
Dapkūnas J, Timinskas A, Olechnovič K, Margelevičius M, Dičiūnas R, Venclovas Č. The PPI3D web server for searching, analyzing and modeling protein-protein interactions in the context of 3D structures. Bioinformatics, 2017, 33:935, DOI: 10.1093/bioinformatics/btw756, PMID: 28011769.
A detailed tutorial how to model structures of protein complexes using PPI3D can be found here:
-
Dapkūnas J, Venclovas Č. Template-Based Modeling of Protein Complexes Using the PPI3D Web Server. Methods Mol Biol, 2020, 2165:139, DOI: 10.1007/978-1-0716-0708-4_8, PMID: 32621223.
References
- Camacho et al., BLAST+: architecture and applications, BMC Bioinformatics, 2009, 10:421.
- Olechnovic et al., CAD-score: a new contact area difference-based function for evaluation of protein structural models, Proteins, 2013, 81:149.
- Sali and Blundell, Comparative protein modelling by satisfaction of spatial restraints, J Mol Biol, 1993, 234:779.
- Janson et al., Revisiting the "satisfaction of spatial restraints" approach of MODELLER for protein homology modeling, PLoS Comput Biol, 2019, 15:e1007219.
- Olechnovic & Venclovas, VoroMQA: Assessment of protein structure quality using interatomic contact areas, Proteins, 2017, 85:1131.
- Dapkunas et al., Structural modeling of protein complexes: Current capabilities and challenges, Proteins, 2019, 87:1222.